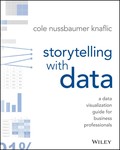
Storytelling with Data
A Data Visualization Guide for Business Professionals

1. Edition November 2015
288 Pages, Softcover
Practical Approach Book
Short Description
Storytelling with Data teaches you the fundamentals of data visualization and how to communicate effectively with data. The lessons in this illuminative text are grounded in theory, but made accessible through numerous real-world examples.
This book demonstrates how to reach the root of your data, and how to use your data to create an engaging, informative, compelling story. Specifically, you'll learn how to:
* Understand the importance of context and audience
* Determine the appropriate type of graph for your situation
* Recognize and eliminate the clutter clouding your information
* Direct your audience's attention to the most important parts of your data
* Think like a designer and utilize concepts of design in data visualization
* Leverage the power of storytelling to help your message resonate with your audience
There is a story in your data--Storytelling with Data will give you the skills and power to tell it!
Don't simply show your data--tell a story with it!
Storytelling with Data teaches you the fundamentals of data visualization and how to communicate effectively with data. You'll discover the power of storytelling and the way to make data a pivotal point in your story. The lessons in this illuminative text are grounded in theory, but made accessible through numerous real-world examples--ready for immediate application to your next graph or presentation.
Storytelling is not an inherent skill, especially when it comes to data visualization, and the tools at our disposal don't make it any easier. This book demonstrates how to go beyond conventional tools to reach the root of your data, and how to use your data to create an engaging, informative, compelling story. Specifically, you'll learn how to:
* Understand the importance of context and audience
* Determine the appropriate type of graph for your situation
* Recognize and eliminate the clutter clouding your information
* Direct your audience's attention to the most important parts of your data
* Think like a designer and utilize concepts of design in data visualization
* Leverage the power of storytelling to help your message resonate with your audience
Together, the lessons in this book will help you turn your data into high impact visual stories that stick with your audience. Rid your world of ineffective graphs, one exploding 3D pie chart at a time. There is a story in your data--Storytelling with Data will give you the skills and power to tell it!
acknowledgments xi
about the author xiii
introduction 1
chapter 1 the importance of context 19
chapter 2 choosing an effective visual 35
chapter 3 clutter is your enemy! 71
chapter 4 focus your audience's attention 99
chapter 5 think like a designer 127
chapter 6 dissecting model visuals 151
chapter 7 lessons in storytelling 165
chapter 8 pulling it all together 187
chapter 9 case studies 207
chapter 10 final thoughts 241
bibliography 257
index 261


